From a conversation
to a report you can send.
Ask DecisionBox for a report and it builds one from what the conversation established: a PDF, an Excel workbook, a Word document or a PowerPoint deck. Every figure in it comes from a query the session ran. After each discovery run, it can also write an executive summary with every number cited.
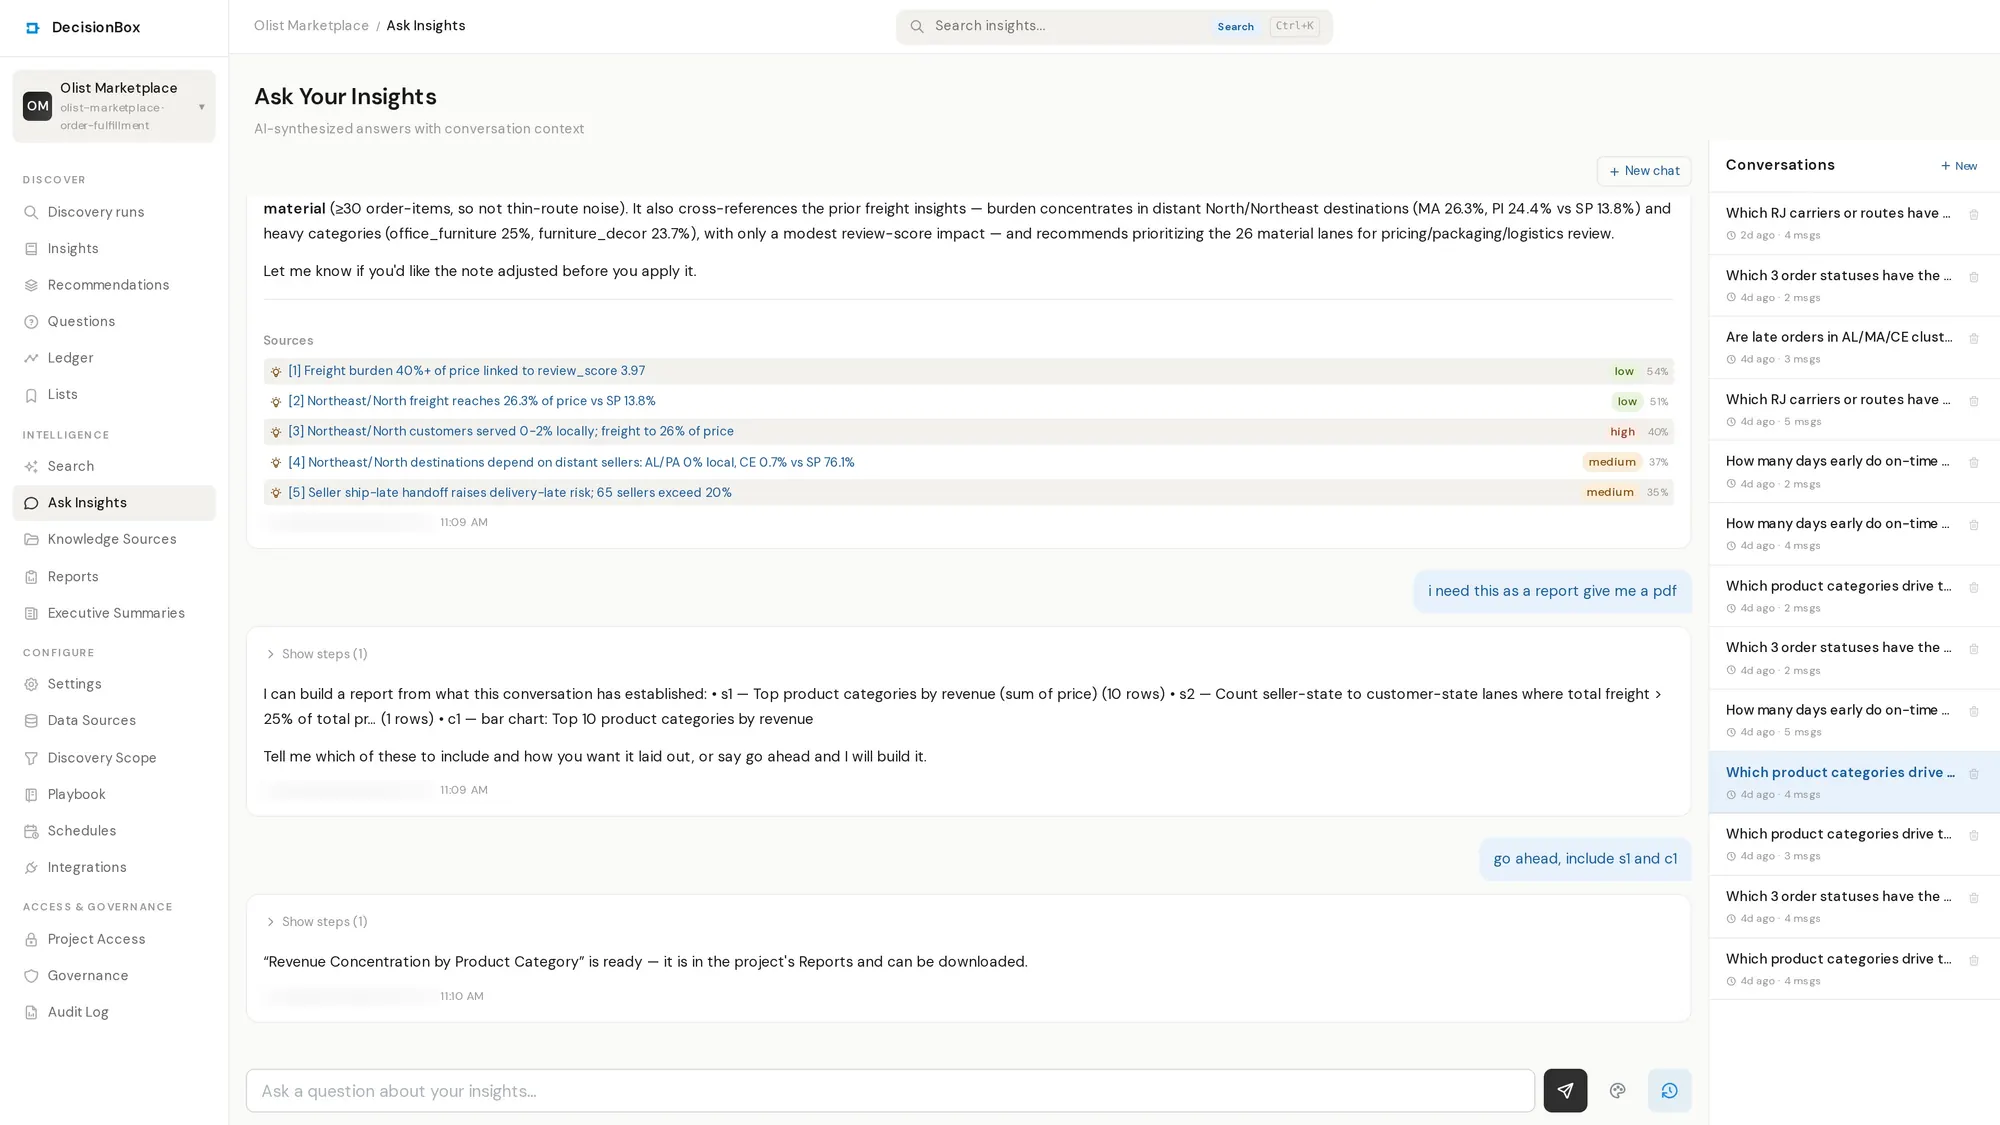
Ask proposes an outline from the queries and the chart already in the conversation. “Go ahead” builds the PDF.
Four steps, all in the conversation
- Ask a question. Ask answers with read-only queries against your warehouse, and charts drawn from the results.
- Ask for a report. It proposes an outline from the queries and charts the conversation already has. You choose what goes in.
- Say go ahead. The file is built and lands in the project's Reports library, with a download link in the conversation.
- Edit it by asking. “Drop section 3.” “Add revenue by region.” “Now as Excel.” Each change is a new version, and earlier versions stay downloadable.
The numbers come from your queries
Tables and headline figures are filled from query results
The model writes the narrative and chooses which results to show. Table rows are filled from the stored result of the query they name. A headline figure has to match a value that query returned. A total or an average the model works out by itself is refused: it has to be computed in SQL and cited instead.
The data is frozen when the report is generated, so editing a report never changes a number someone has already seen.
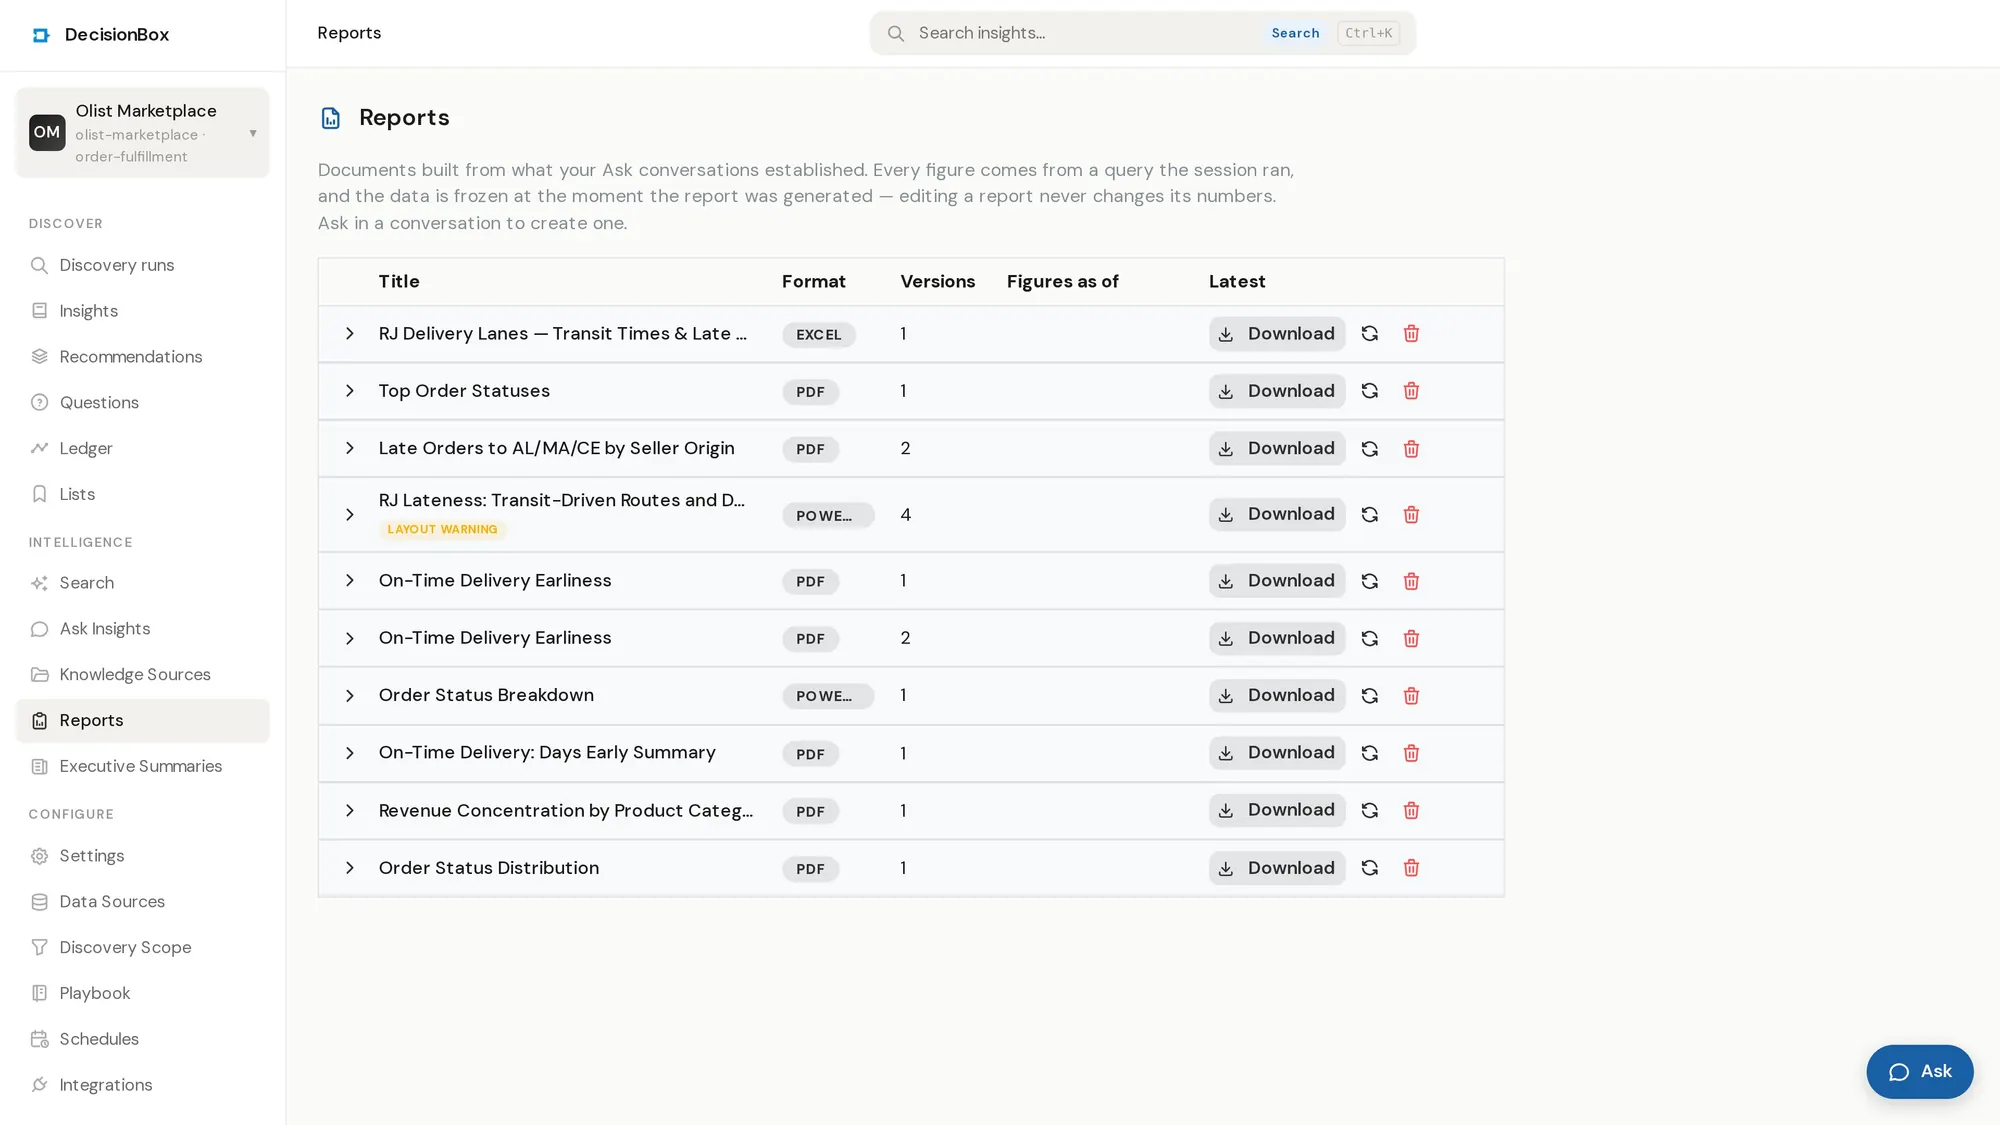
The Reports library: each report with its format, its versions and a download button.
PDF, Excel, Word or PowerPoint
Pick the format that suits the reader. A PDF for a quick read, a workbook with the data and the chart for someone who wants to check it, a Word document to edit further, or a deck for the next meeting. Reports belong to the person who made them, like the Ask conversation they came from.
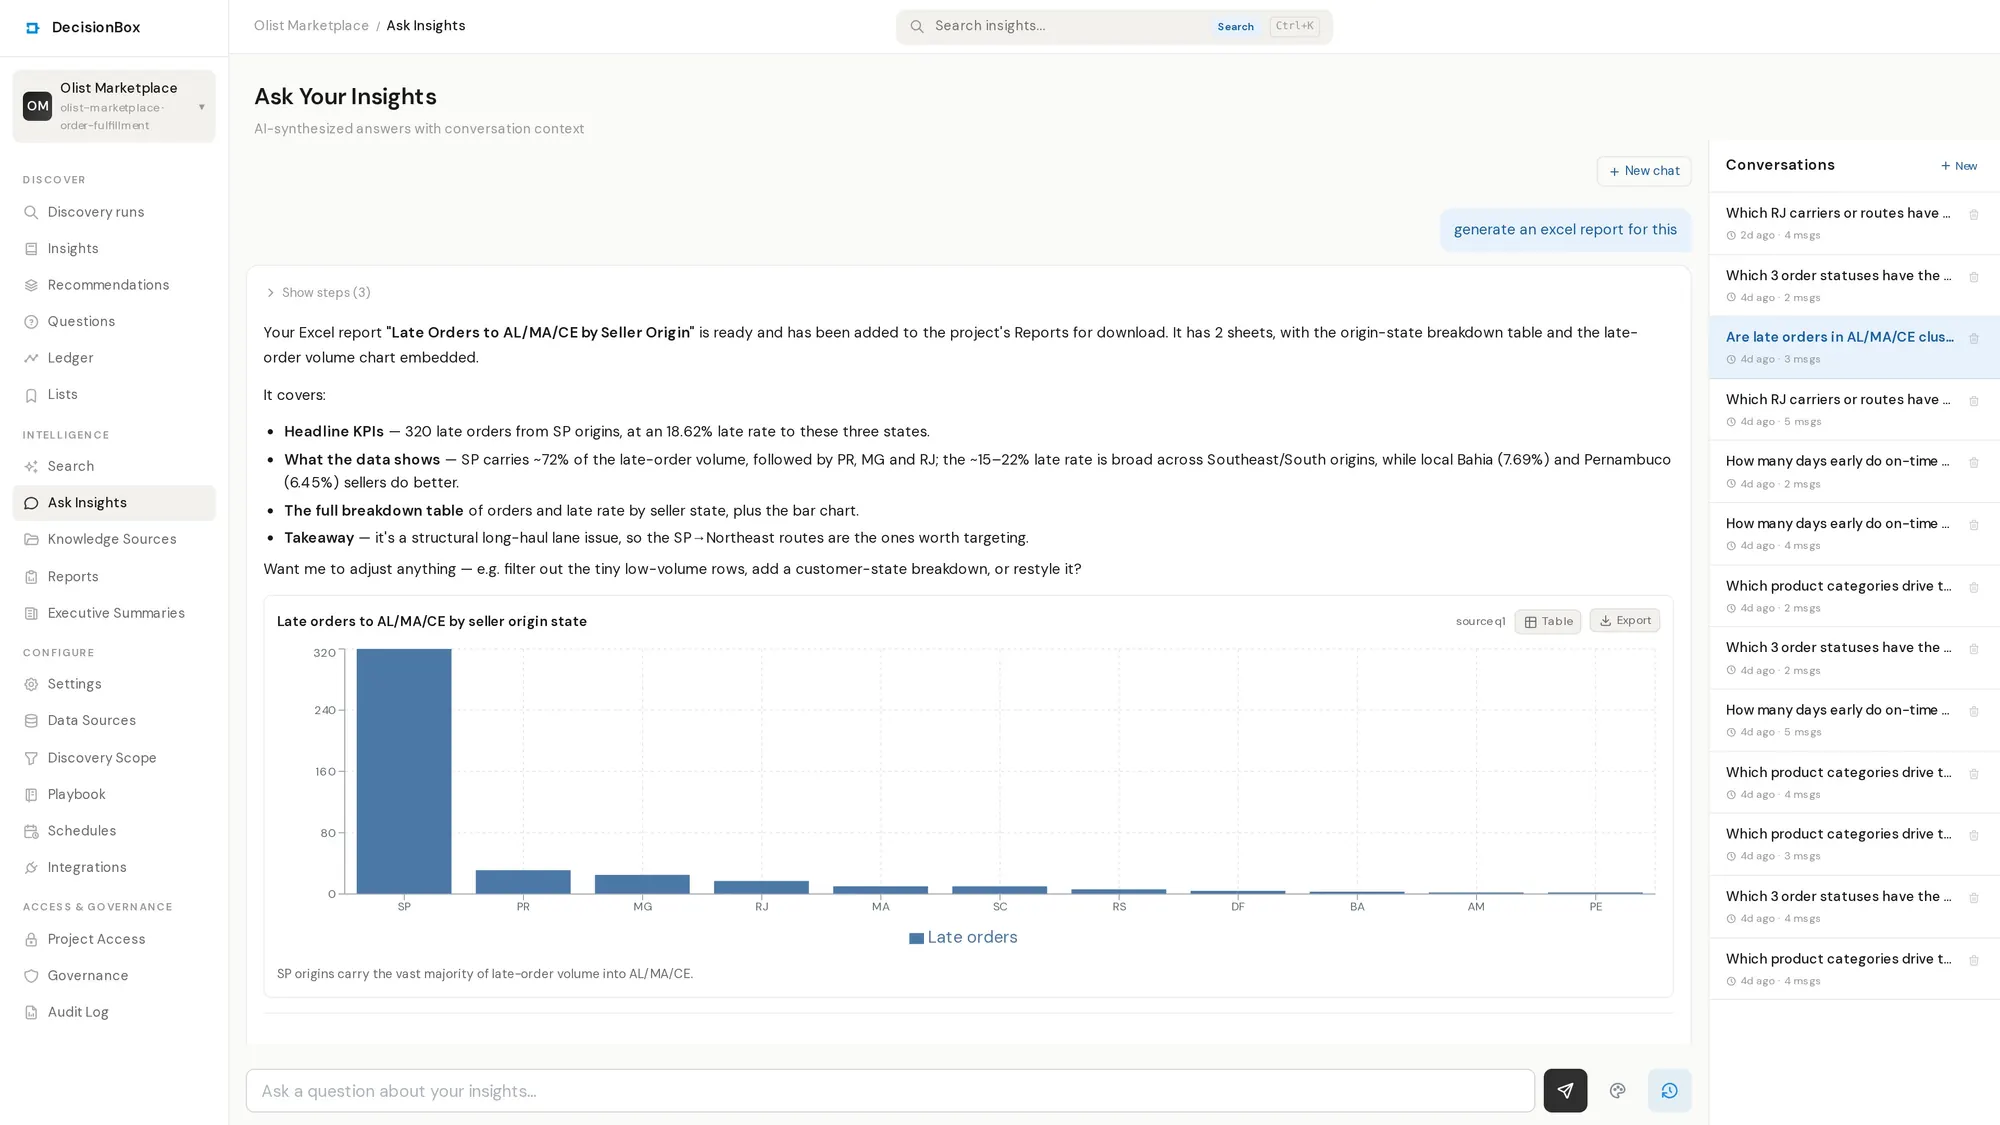
An Excel report with two sheets, holding the breakdown table and the chart.
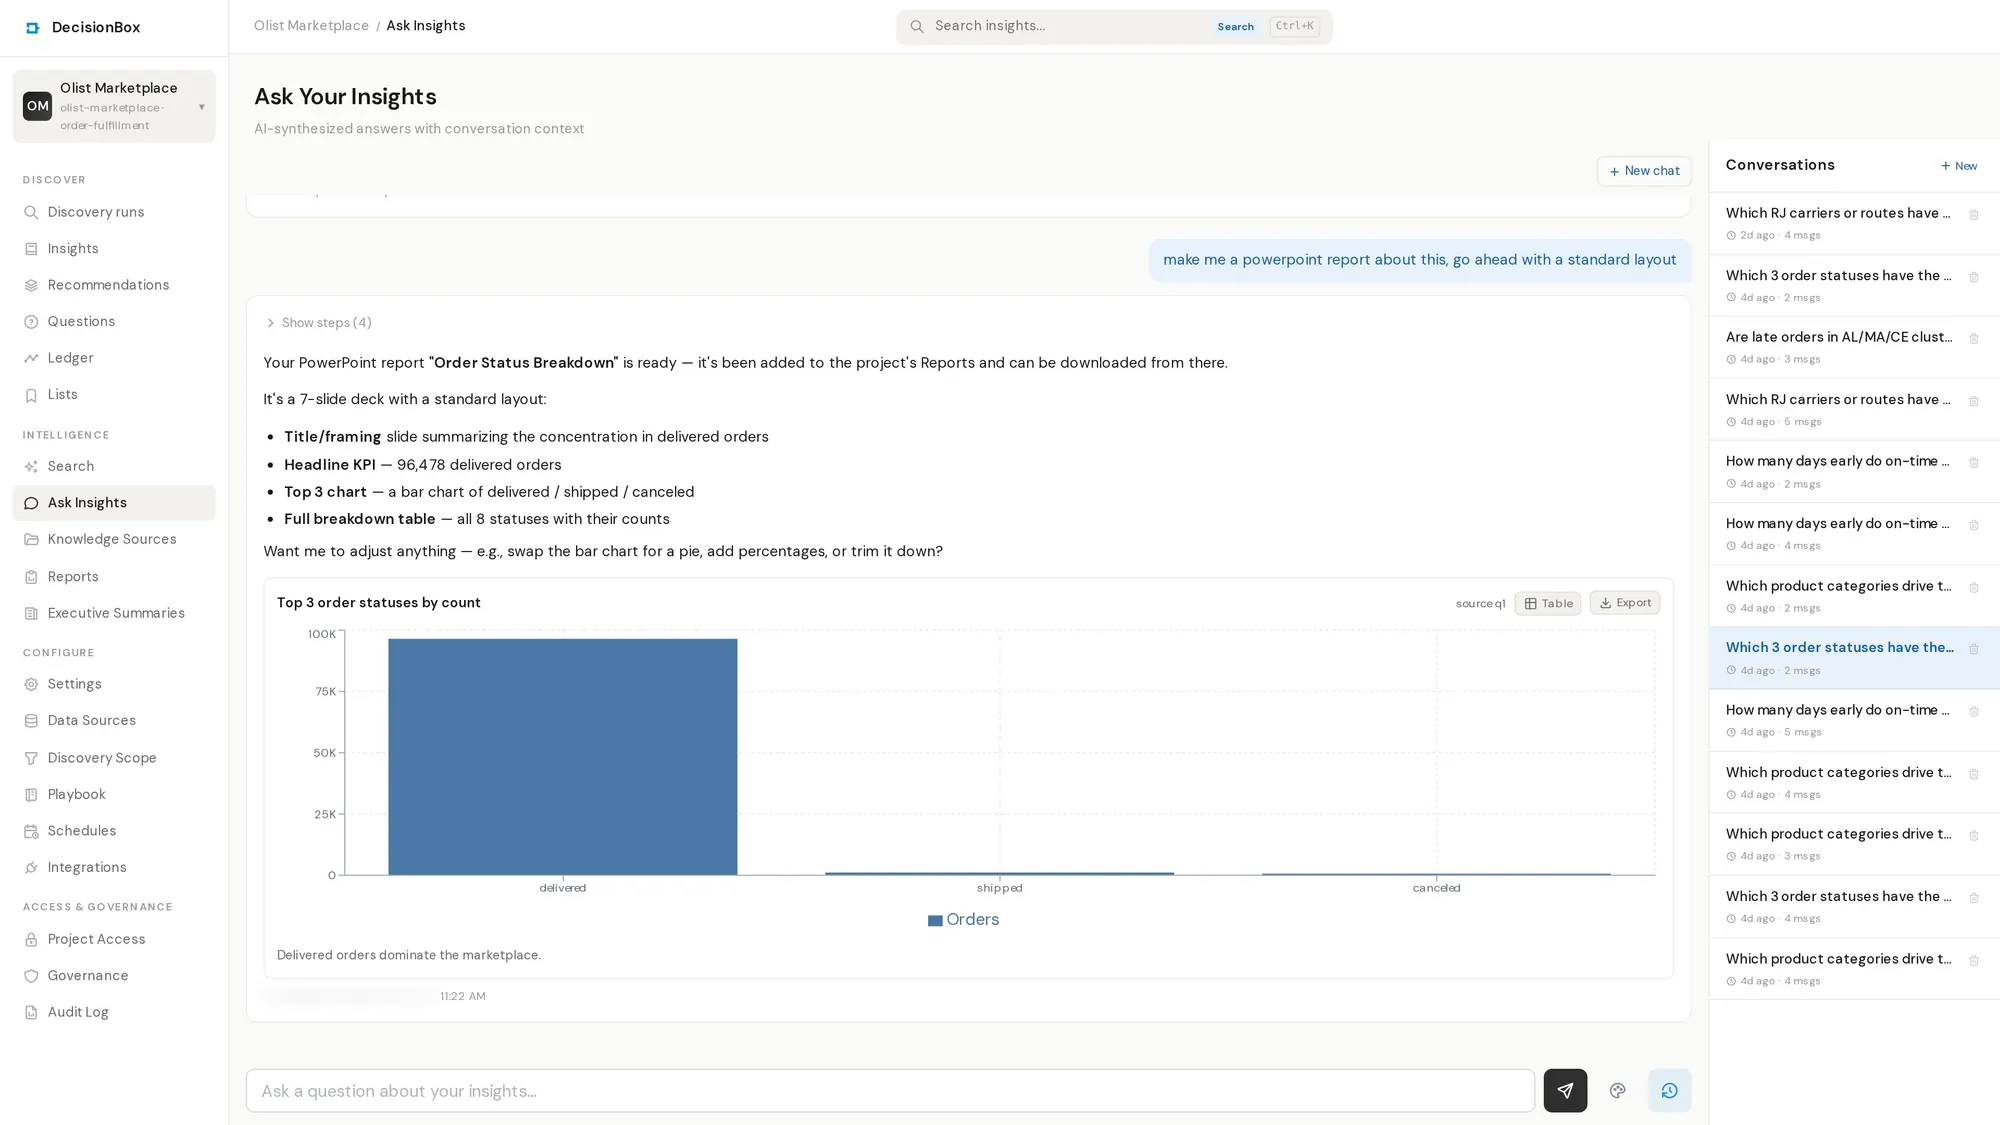
A seven-slide PowerPoint deck, built from an Ask conversation about order statuses.
An executive summary after each run
When a discovery run finishes, DecisionBox can write an executive summary for people who won't open the dashboard. It reads like a short newspaper: a lead story, a page for each theme, an action page and a note on how it was made.
Every figure in it is cited to the insight or recommendation it came from. Click a citation to open that finding. If the summary can't be grounded in the run's findings, it is regenerated once and otherwise marked as failed, so a half-correct summary is never published. Print it to PDF from the browser, or have it emailed when the run completes.
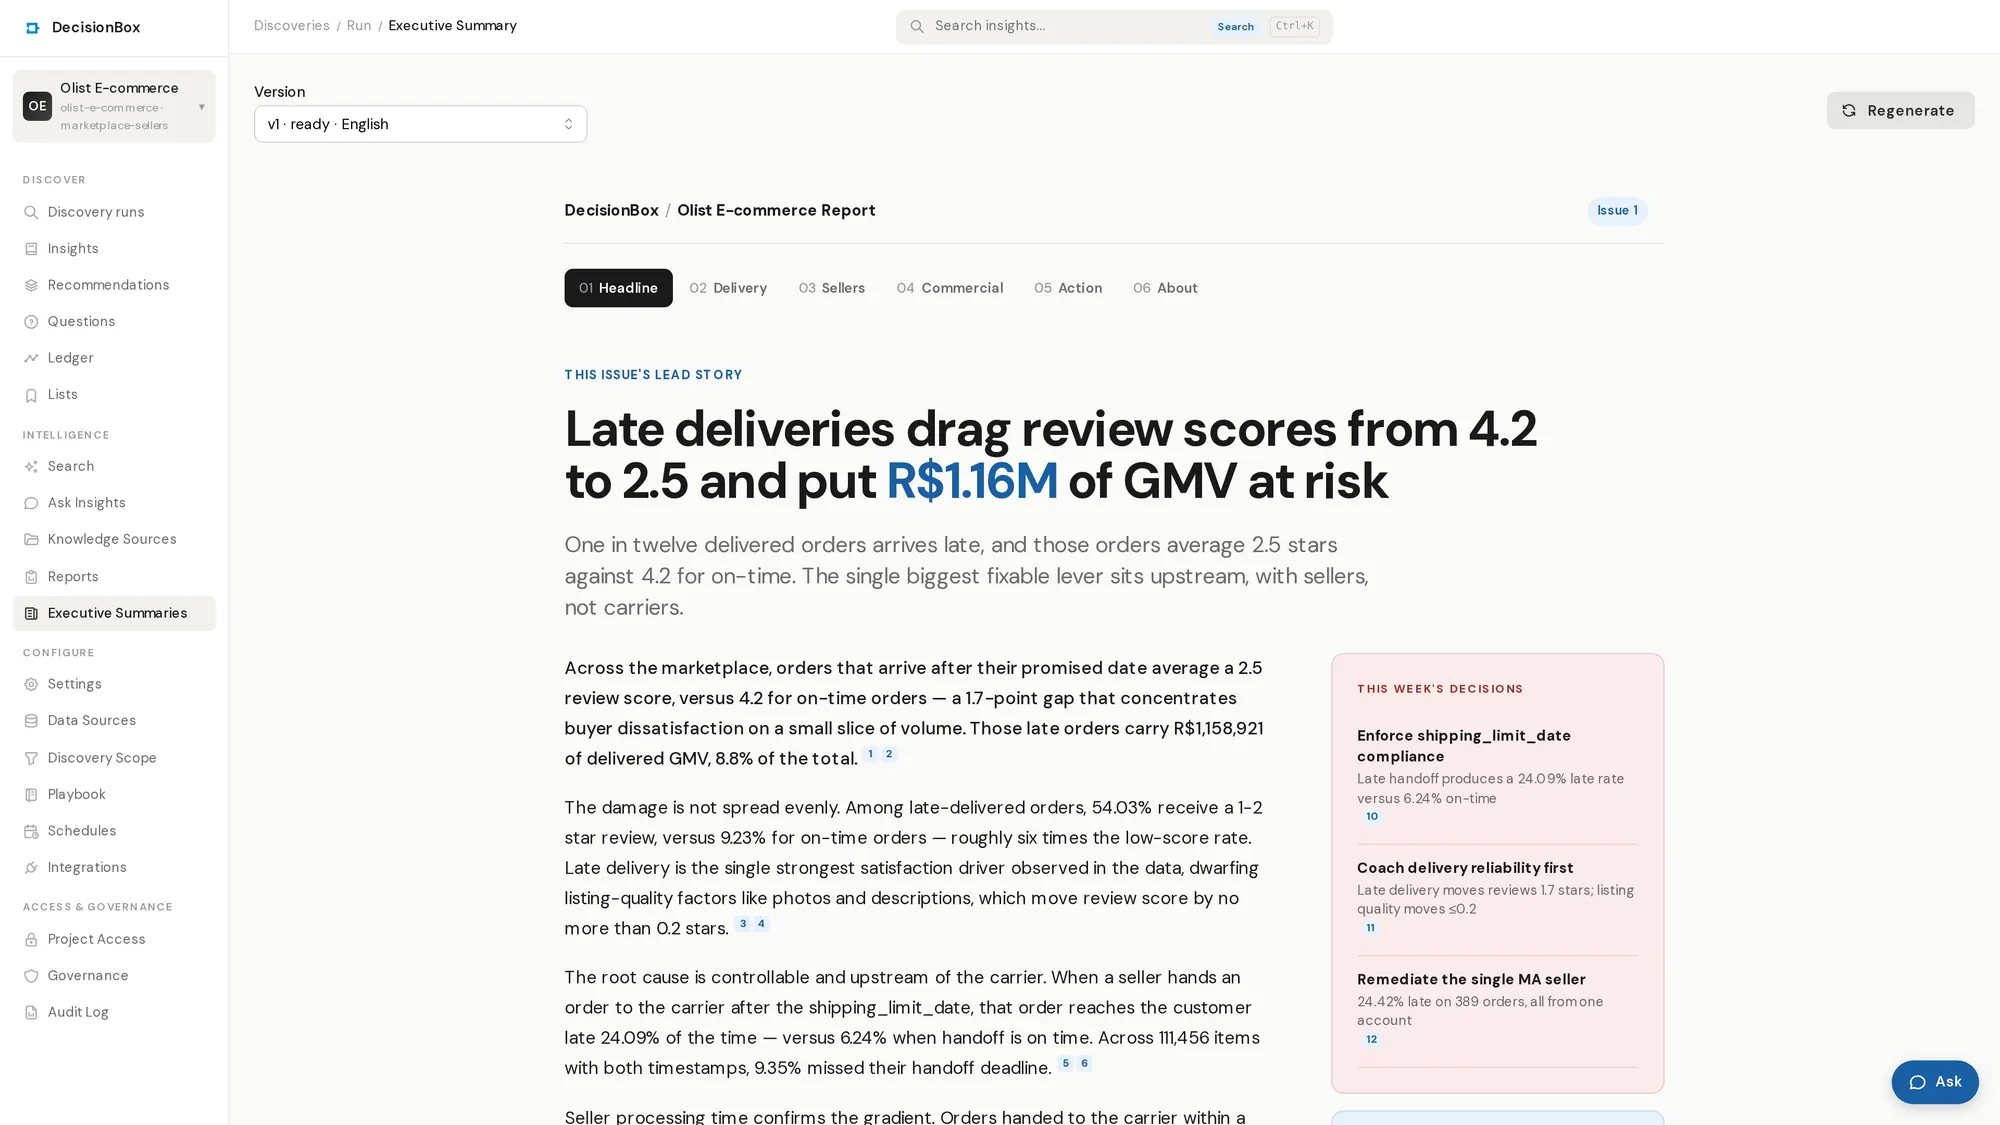
An executive summary for one run on a public e-commerce dataset. The small numbered links in the text cite the run's findings and recommendations.
Reports and executive summaries are Enterprise features. In the open-source Community edition, Ask answers questions about past findings, with sources.
Questions people ask
Which formats can a report use?
PDF, Excel, Word and PowerPoint. You can ask for the same report in another format at any time.
Can the AI make up a number in a report?
Table rows and headline figures have to come from stored query results, and a figure the model calculated by itself is refused. The narrative around them is written by the model, so read it the way you would read an analyst's summary: the numbers are checked against the queries, the wording is the model's.
What happens to the numbers when I edit a report?
Nothing. The data is frozen when the report is first generated. An edit makes a new version from the same data, and earlier versions stay downloadable.
Who can see my reports?
The person who made them, the same as the Ask conversation they came from.
How is the executive summary different from a report?
A report comes from one Ask conversation and cites the queries it ran. The executive summary covers a whole discovery run and cites its findings and recommendations.